A support team pulls up its dashboard and sees an 86% CSAT score. It looks like a good quarter. But that number is an average of very different experiences: billing questions score 94%, live chat sits at 88%, returns land at 73%, and any conversation that got transferred between agents averages 69%. The overall figure never would have surfaced that problem on its own.
Customer satisfaction score (CSAT) is a metric that measures how satisfied a customer feels about a specific interaction, purchase, or support experience, usually collected right after that experience happens. It matters because it’s the fastest way to hear, in a single number, whether your product or support is meeting expectations. But that number only becomes useful once you know what’s inside it. This guide walks through how to calculate CSAT correctly, how to build a survey that produces trustworthy data, and the part most guides skip: how to segment a score so it tells you something you can act on.
Quick Answer
Customer Satisfaction Score (CSAT) measures how satisfied a customer was with a specific interaction, product, or service, usually captured through a short post-interaction survey. CSAT measures near-term, transactional satisfaction, not overall loyalty or long-term relationship health.
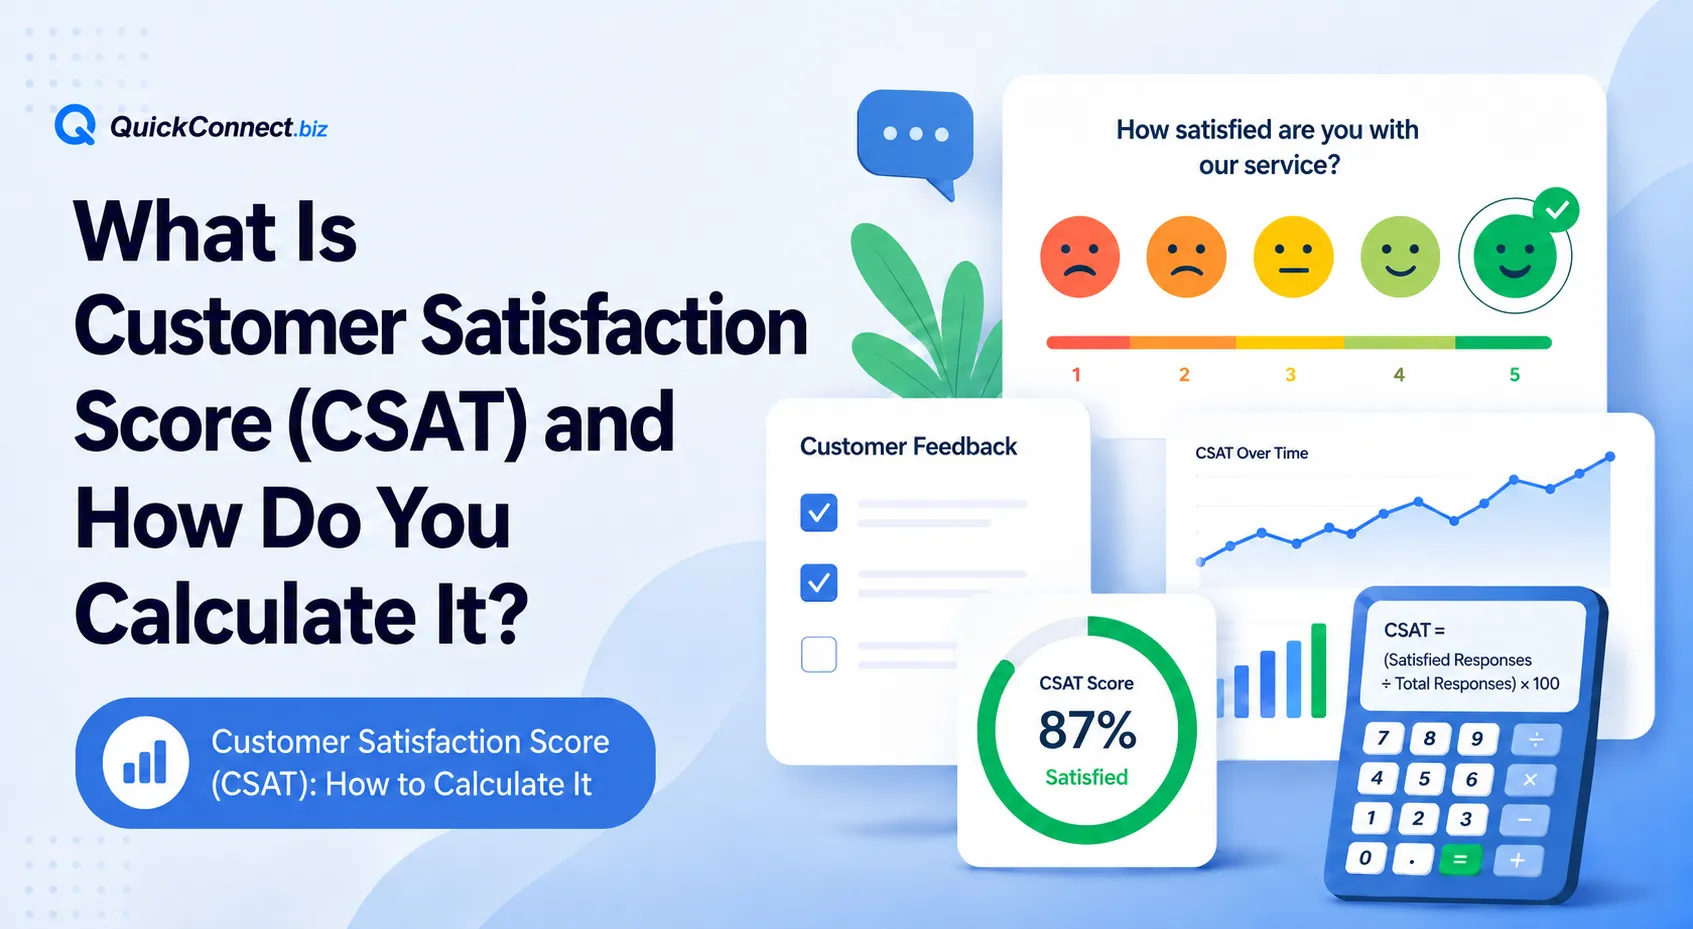
Basic formula:
On a standard five-point scale, satisfied responses typically mean ratings of 4 (satisfied) and 5 (very satisfied).
(138 + 66) ÷ 240 × 100 = 85%
What is Customer Satisfaction Score?
CSAT is a customer experience metric that captures how a customer felt about one specific touchpoint, a support conversation, a purchase, or an onboarding session, rather than their overall opinion of your brand. It’s typically collected through a short survey sent immediately after the interaction, using a 1–5 or 1–10 rating scale, or sometimes a simple binary “good/bad” response.
Because it’s tied to a specific moment, CSAT is considered a short-term, interaction-level signal rather than a measure of long-term loyalty. That’s a meaningful distinction from relationship CSAT or NPS, both of which ask customers to reflect on the business as a whole. The same underlying method a satisfaction rating collected right after an event can also be adapted for onboarding, purchase, product feature adoption, or renewal experiences, not just support conversations.
Example: A customer contacts support about a failed payment. The issue gets resolved in one conversation. Thirty minutes later, they receive: “How satisfied were you with the support you received today?” Their answer is a transactional CSAT data point. It reflects that one conversation, not their five-year relationship with the company.
How to calculate CSAT
Step by step:
- Collect responses on a defined scale (commonly 1–5).
- Identify which ratings count as “satisfied,” usually the top two values on the scale.
- Divide the count of satisfied responses by the total number of responses.
- Multiply by 100.
The five-point scale is categorized:
| Rating | Label | Counted in the numerator? |
|---|---|---|
| 5 | Very satisfied | Yes |
| 4 | Satisfied | Yes |
| 3 | Neutral | No |
| 2 | Dissatisfied | No |
| 1 | Very dissatisfied | No |
Worked example: A team collects 240 responses: 138 “very satisfied,” 66 “satisfied,” and the remainder split across neutral and dissatisfied.
CSAT = (138 + 66) ÷ 240 × 100 = 204 ÷ 240 × 100 = 85%
This is the “top-two-box” or percentage-positive method. It counts only the top ratings, rather than averaging every response on a 1–5 scale. That distinction matters: a simple average would treat a 3 (neutral) as contributing positively toward the score, which overstates satisfaction. Percentage-positive scoring is more conservative and is the industry-standard approach.
Whichever method you choose, use the same scale, the same question wording, and the same calculation method every time. Switching from a 5-point to a 10-point scale, or from percentage-positive to an average, breaks your ability to compare scores over time the resulting trend line isn’t measuring the same thing anymore.
CSAT calculator (editor/developer note)
Spec for an embedded calculator widget:
Input fields:
- Very satisfied (count)
- Satisfied (count)
- Neutral (count)
- Dissatisfied (count)
- Very dissatisfied (count)
Calculation logic:
- Total responses = sum of all five fields
- CSAT % = ((Very satisfied + Satisfied) ÷ Total) × 100
- Category percentage = (category count ÷ Total) × 100, for each of the five categories
Display output:
- Total responses collected
- Overall CSAT percentage (large, primary display)
- Breakdown bar or table showing the percentage in each of the five categories
Interpretation copy (shown below the result): “This number reflects your overall response set. Before concluding, compare it against your own historical average and against results for a specific channel, issue type, or agent, an aggregate score can look acceptable while a specific segment of your support experience is underperforming.”
What does a CSAT score actually tell you?
A CSAT score is a reliable snapshot of immediate reaction: how someone perceived one interaction, whether a process change moved the needle, and whether one channel or team is trending up or down relative to itself. Used consistently, it can surface recurring dissatisfaction patterns worth investigating and can point toward coaching opportunities for individual agents or teams.
What it can’t prove on its own:
- Long-term loyalty or the likelihood of a repeat purchase
- Whether the customer will recommend you to others
- The exact reason behind any individual score, the number alone doesn’t explain itself
- Whether the customer’s issue was genuinely, fully resolved (as opposed to just closed)
- Whether the customers who didn’t respond had a similar experience to those who did
- Whether one channel is objectively better than another, without controlling for the type of issue each channel typically handles
- Whether a high score caused retention or revenue growth, as opposed to correlating with it
CSAT is a useful, low-effort signal, but it’s a starting point for investigation, not a verdict.
Transactional CSAT vs. relationship CSAT
| Transactional CSAT | Relationship CSAT | |
|---|---|---|
| Purpose | Measure satisfaction with one specific interaction | Measure broader satisfaction with the business over time |
| Typical question | “How satisfied were you with today’s support?” | “How satisfied are you with [Company] overall?” |
| Timing | Immediately after the interaction | Periodically (quarterly, semi-annually) |
| Frequency | Every interaction or a sampled subset | Scheduled survey waves |
| Best use | Quarterly account-satisfaction survey for a business customer | Tracking overall account health and sentiment |
| Main limitation | Doesn’t capture the full relationship | Doesn’t pinpoint which interaction drove the sentiment |
| Example | Post-chat rating after a billing question | Quarterly account-satisfaction survey to a business customer |
Don’t mix the two in a single trend line. A transactional CSAT trend answers “Are our interactions getting better or worse?” A relationship CSAT trend answers “is the customer’s overall view of us improving?” Blending them produces a number that answers neither question cleanly.
When should you send a CSAT survey?
Timing affects the data. Surveys should generally go out while the experience is still fresh, but only after the outcome is actually known. Asking someone to rate a refund before the refund has been processed produces noise, not signal.
| Situation | Recommended timing | Trigger | Best channel | What it diagnoses | Common mistake to avoid |
|---|---|---|---|---|---|
| 30–60 days before the renewal date | Immediately after chat ends | Chat marked closed | In-chat rating prompt | Real-time interaction quality | Prompting mid-conversation before resolution |
| 30–60 days before the renewal date | 1–24 hours after resolution | Ticket status = resolved | Email or in-app | Resolution quality, agent performance | Sending before the fix has actually taken effect |
| 30–60 days before the renewal date | Immediately after bot response | Conversation ends without escalation | In-chat / in-app | Bot answer accuracy and usefulness | Treating all bot conversations as equivalent regardless of complexity |
| After human-agent takeover | After the handoff conversation resolves | Escalated conversation closed | Same channel as the conversation | Handoff quality, context transfer | Attributing bot performance issues to the human agent |
| After purchase or delivery | Shortly after delivery confirmation | Delivery status update | Fulfillment and product-received experience | Sending before delivery is confirmed | |
| After onboarding | End of onboarding flow or first successful use | Onboarding milestone completed | Email or in-app | Onboarding clarity and friction points | Sending too early, before the customer has tried the product |
| After complaint resolution | After resolution confirmed with customer | Complaint marked resolved | Same channel used to file complaint | Whether the resolution actually satisfied the customer | Closing the loop without checking back in |
| After return/refund | After refund is completed | Refund processed | Return-process friction | Surveying before the refund lands | |
| After using a product feature | Shortly after meaningful feature use | Feature-use event | In-app | Feature usability and value | Surveying casual or accidental feature exposure |
| Before/after renewal | 30–60 days before renewal date | Renewal window opens | Renewal-risk signals | Sending only after the customer has already decided not to renew | |
| Periodic relationship survey | Quarterly or semi-annually | Scheduled | Overall account health | Using this cadence to measure single-interaction quality |
CSAT survey questions and templates
- Basic interaction question: “How satisfied were you with the support you received today?”
- Resolution-focused question: “How satisfied are you with the resolution of your issue?”
- Product-focused question: “How satisfied are you with [product or feature]?”
- Onboarding question: “How satisfied are you with your onboarding experience?”
- AI support question: “How satisfied were you with the answer provided by our virtual assistant?”
- Human-handoff question: “How satisfied were you with the transition from automated to human support?”
Every primary question should be paired with an open-ended follow-up:
- “What was the main reason for your rating?”
- “What could we have done better?”
- “What worked particularly well?”
- “Was your issue completely resolved?”
The written comment often carries more actionable detail than the number itself. A score tells you whether something went wrong. The comment tells you what.
Wording mistakes to avoid:
- Leading questions (“How great was your experience today?”)
- Two questions combined into one (“Were you satisfied with the speed and accuracy of your answer?”)
- Vague time frames (“How satisfied are you with our service?” with no reference point)
- Asking about the agent when the root cause was a policy or product limitation
- Switching scales between surveys (1–5 one month, 1–10 the next)
- Excessively long surveys that reduce response rates
What is a good CSAT score?
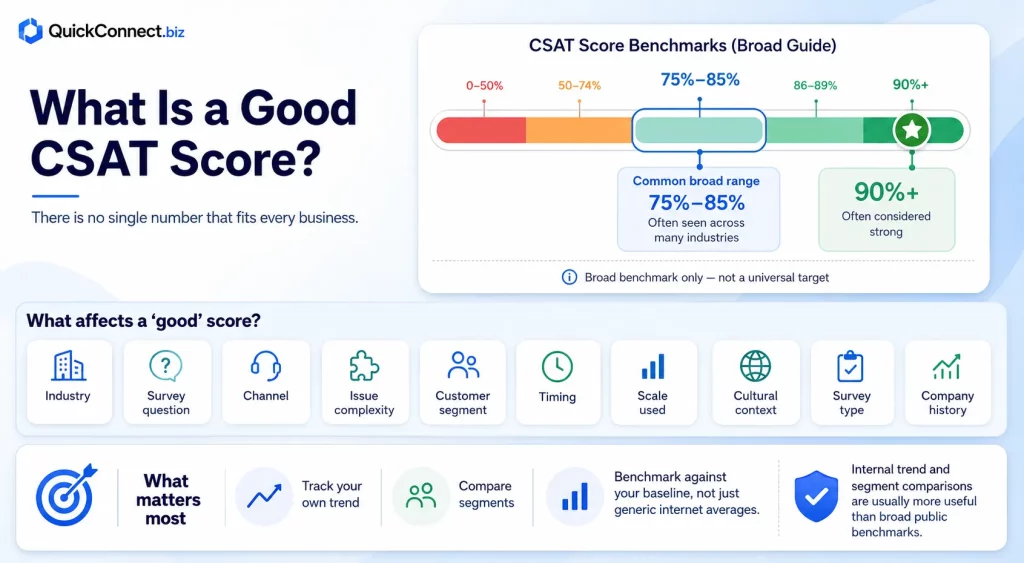
There’s no single number that applies to every business. What counts as “good” depends on industry, the exact question asked, the channel, issue complexity, customer segment, timing, the scale used, cultural context, whether the survey is transactional or relationship-based, and the organization’s own history.
Many industry sources describe scores in the mid-70s to mid-80s (percentage-positive) as a common range, with figures above 90% considered strong, but that’s a general pattern across broad datasets, not a target that automatically applies to your business.
Internal trend and segment comparisons are almost always more useful than a generic internet benchmark: is your score improving relative to your own baseline, and how does one segment compare to another?
A note on the ACSI: The American Customer Satisfaction Index (ACSI) is sometimes cited alongside CSAT benchmarks, but the two aren’t interchangeable. Standard CSAT typically reports the percentage of respondents choosing the top two options on a single post-interaction question. ACSI instead uses a weighted model built from several separate survey questions, tracked across roughly 400 companies. As of Q4 2025, the national ACSI score stood at 76.9 out of 100, a figure useful for understanding broad economic sentiment, but not a like-for-like comparison to a company’s own post-support CSAT number.
Why CSAT results can be misleading
A raw CSAT number can be distorted by measurement issues that have nothing to do with actual service quality:
| Issue | What it does | Practical remedy |
|---|---|---|
| Nonresponse bias | Only the most engaged (often most upset or most delighted) customers respond | Track response rate. Treat low-response segments cautiously |
| Extreme-response bias | Some respondents default to 1s and 5s, skipping the middle | Look at the distribution shape, not just the top-two-box percentage |
| Small sample size | A handful of responses can swing the score dramatically | Set a minimum response threshold before reporting a segment score |
| Cultural response patterns | Some cultures rate more harshly or more generously on average | Compare within-region trends rather than across regions directly |
| Survey fatigue | Repeated requests lower response rates and skew who responds | Cap survey frequency per customer |
| Timing bias | Surveying before an outcome is final skews results | Trigger surveys only after resolution is confirmed |
| Channel bias | Easier issues cluster on easier channels, inflating that channel’s score | Segment by issue type within each channel before comparing |
| Agent-selection bias | Easier tickets may be routed to certain agents | Normalize comparisons by issue complexity, not raw score |
| Issue-complexity bias | Complex cases score lower regardless of agent skill | Segment scores by issue type |
| Incentive-related bias | Rewards for rating “5” distort honest feedback | Avoid incentivizing specific ratings |
| Duplicate responses | Multiple submissions from one interaction inflate or skew counts | De-duplicate by ticket/conversation ID |
| Changes in survey wording | Different questions aren’t measuring the same thing | Lock the wording before comparing across time periods |
| Comparing different scales | A 1–5 score isn’t directly comparable to a 1–10 score | Standardize on one scale organization-wide |
| Comparing bot vs. complex human cases | Simple bot-resolved queries naturally score higher | Segment automated and human-escalated conversations separately |
Example: A team notices website live chat scores higher than email and concludes live chat is the stronger channel. But live chat mostly handles quick password resets, while email handles disputes, cancellations, and complex billing issues. The channels aren’t being compared on equal footing, the issue mix explains the gap, not channel quality. Segmentation by issue type, not just channel, is what turns this from a misleading conclusion into an accurate one.
The QuickConnect SCORE framework
To move from “we have a number” to “we know what to do about it,” this guide proposes a five-step framework:
S — Send at the right moment. Trigger the survey after a meaningful interaction or a completed outcome, not before the result is known.
C — Calculate consistently. Use the same question, scale, and scoring method every time so results remain comparable over time.
O — Observe the context. Segment every response by channel, issue type, agent, product area, customer group, and resolution status before concluding.
R — Resolve the root cause. Combine the rating with the written comment and operational data (response time, transfers, reopens) to identify what actually caused the result.
E — Evaluate the change. After making a fix, re-measure the same segment, not the overall average to confirm the change worked.
Illustrative example (fictional, not an actual QuickConnect customer case study): An ecommerce support team notices overall CSAT sitting at a stable 84%. Applying SCORE: they confirm the calculation method hasn’t changed (Calculate), segment by issue type (Observe), and find that returns-related conversations sit at 71% while everything else clusters around 88–92%. Reading the written comments (Resolve) reveals a recurring complaint: customers are asked to repeat their order number across multiple messages because agents lack full conversation history. The team implements a fix surfacing prior conversation context automatically to agents, and after 60 days, re-checks the returns segment specifically (Evaluate), rather than only the overall number, to see whether the fix moved the metric that was actually broken.
How to analyze CSAT properly
- Confirm the calculation method has stayed consistent over the period you’re comparing.
- Check response rate and sample size before trusting the number.
- Review the overall trend, not a single period in isolation.
- Segment by channel.
- Segment by customer issue type.
- Compare resolved vs. unresolved cases separately.
- Review agent- and team-level patterns carefully, accounting for issue difficulty.
- Read the open-ended feedback attached to low scores.
- Cross-reference CSAT with operational metrics: first-response time, average resolution time, first-contact resolution, reopen rate, transfer rate, abandonment rate, AI containment rate, human-handoff rate, Customer Effort Score, and repeat-contact rate.
- Identify a specific fix, implement it, and re-measure the same segment.
A CSAT drop that correlates with a spike in transfer rate is a different problem from a CSAT drop with stable transfers. Correlation between two metrics is a lead worth investigating, not proof of what caused what.
CSAT vs. NPS vs. CES
| CSAT | NPS | CES | |
|---|---|---|---|
| Full name | Customer Satisfaction Score | Net Promoter Score | Customer Effort Score |
| What it measures | Satisfaction with a specific interaction, product, or service | Willingness to recommend the business | How easy or difficult it was to complete a task or resolve an issue |
| Typical question | “How satisfied were you with…?” | “How likely are you to recommend us?” | “How easy was it to get your issue resolved?” |
| Typical scale | 1–5 or 1–10 | 0–10 | 1–5 or 1–7 |
| Best timing | Immediately after an interaction | Periodically, relationship-level | Immediately after a task or resolution |
| Best use case | Diagnosing specific touchpoints | Tracking broader loyalty and advocacy | Identifying friction in a process |
| Main limitation | Doesn’t explain long-term loyalty | Doesn’t pinpoint which interaction drove the score | Doesn’t capture emotional satisfaction |
Decision guide: Use CSAT when you want to know whether the customer was satisfied with something specific. Use CES when you want to know whether a process was easy. Use NPS when you’re assessing broader loyalty or advocacy. None of the three is universally superior. Many mature support teams track more than one because each answers a different business question.
How to improve Customer Satisfaction Score
Generic advice like “provide better service” doesn’t give a team anything to act on. Each item below ties a specific operational lever to the metric it affects.
- Reduce first-response delays. Slow first responses increase perceived effort before the issue is even addressed. Monitor first-response time by channel. Example: a queue that routes simple questions to a bot first can cut human first-response time for complex issues.
- Improve first-contact resolution. Repeated back-and-forth erodes satisfaction even when the final outcome is correct. Monitor reopen and repeat-contact rate.
- Preserve conversation context across channels. Customers who repeat themselves after switching channels report lower satisfaction regardless of the final resolution. Monitor transfer-related CSAT specifically.
- Reduce unnecessary transfers. Each transfer is a point of friction and information loss. Monitor transfer rate and transfer-segment CSAT.
- Set accurate expectations. Overpromising response times or outcomes creates a satisfaction gap even when service is objectively fine. Monitor variance between promised and actual timelines.
- Make escalation to a human easy. A bot that traps a frustrated customer in automation compounds dissatisfaction. Monitor escalation request rate and time-to-human.
- Improve the quality of automated answers. Inaccurate bot responses damage trust faster than slow ones. Monitor bot-specific CSAT and containment accuracy.
- Maintain an accurate knowledge base. Outdated articles produce wrong answers from both agents and bots. Monitor knowledge-base-sourced resolution accuracy.
- Give agents complete conversation history. Agents working blind repeat questions customers have already answered. Monitor CSAT on transferred vs. non-transferred conversations.
- Train agents using low-score interaction patterns. Real low-scoring transcripts are more useful training material than generic scripts. Monitor CSAT trend for coached agents.
- Simplify policies and processes. Complicated return or refund policies generate dissatisfaction independent of agent performance. Monitor CSAT specifically on policy-heavy interaction types.
- Follow up with dissatisfied customers. A low score without follow-up is a missed recovery opportunity. Monitor follow-up completion rate on scores below a defined threshold.
- Close the feedback loop. Telling a customer that their comment led to a change rebuilds trust. Monitor repeat-customer sentiment after loop closure.
- Measure changes by segment, not only the overall score. A fix targeted at one problem area can be invisible in an aggregate number. Monitor the specific segment the fix was meant to improve.
Faster responses do not guarantee a higher score if the answer is inaccurate or the underlying problem remains unresolved. Speed and quality need to be tracked together, not treated as substitutes for each other.
CSAT action matrix
| Observed pattern | Possible interpretation | Data to check | Recommended action |
|---|---|---|---|
| CSAT falls while response time increases | Overall, CSAT is stable, but the response rate falls | First-response time trend, staffing levels | Investigate queue capacity and routing |
| The bot may be over-scoped beyond its accuracy | Cause is likely resolution quality, not speed | Reopen rate, comment themes | Read low-score comments for a pattern |
| Bot CSAT high for FAQs, low for account-specific issues | Bot may be over-scoped beyond its accuracy | Bot escalation rate by issue type | Narrow bot scope or improve account-data access |
| Transfer-heavy conversations score low | Context loss during handoff | Transfer count per conversation | Improve context-passing between agents/bot |
| One channel scores lower than others | Could be issue-mix, not channel quality | Issue-type distribution per channel | Segment by issue type before concluding |
| One product category gets repeated negative comments | Product or documentation gap | Comment themes tagged by product area | Route findings to product/knowledge-base owners |
| One channel scores lower than the others | Survey fatigue or declining relevance | Response rate trend, survey frequency | Reduce survey frequency, improve targeting |
| CSAT improves while repeat contacts increase | Score may reflect politeness, not resolution | Repeat-contact rate, reopen rate | Investigate whether issues are truly resolved |
How AI and omnichannel support affect CSAT
AI and automation can influence the operational drivers behind CSAT in a few concrete ways: faster answers to repetitive questions, more consistent responses pulled from a shared knowledge base, better categorization of incoming conversations, response suggestions that help agents answer faster, smarter routing and assignment, always-available first-line support outside business hours, and better detection of when a conversation needs a human.
These are real, mechanism-level benefits, but they come with real risks. Incorrect automated answers can do more damage than a slow human response. A poorly maintained knowledge source will confidently produce wrong information. Automation loops that fail to recognize a stuck conversation frustrate customers who can’t reach a person. Context can be lost at the handoff from bot to agent, undoing much of automation’s speed advantage. And measuring automation success purely by “deflection”, how many conversations never reached a human, can hide the fact that some of those conversations ended in an inaccurate or incomplete answer rather than a resolved one.
The practical takeaway: automation should be evaluated by customer outcomes, resolution quality, escalation appropriateness, and follow-up contact rate, not only by how many conversations it kept away from a human agent.
Teams managing conversations across live chat, messaging apps, and email often see exactly this pattern: an AI-powered customer support platform can accelerate first response and keep context connected as a conversation moves between an AI customer-service bot and a human agent, which matters for the transfer- and handoff-related CSAT patterns discussed above. It doesn’t automatically raise a CSAT score, but it does remove some of the specific friction points (lost context, repeated questions, slow first response) that this guide has shown tend to drag segment-level scores down.
Conclusion
A CSAT percentage on its own doesn’t tell a support team much. It becomes useful the moment someone segments it, reads what’s behind the number, and connects it to a specific interaction, channel, or workflow that can actually be changed. That’s the difference between reporting a score and using one.
QuickConnect brings customer conversations, AI assistance, automation, and human-agent support into a single unified inbox, helping teams see the operational detail, channel, conversation history, and resolution status that sit behind a CSAT number and making it possible to investigate. It won’t guarantee a higher score, but it can make the investigation a lot faster.
Improve Your Customer Support Experience
See how QuickConnect handles customer conversations across multiple channels, or explore the customer support platform directly.